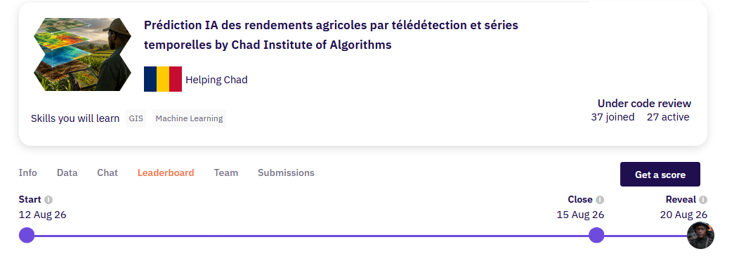
New Zindi challenge, new obsession for a few weeks. This one was about a topic that speaks to me directly: predicting agricultural yields in Africa from satellite data, for Chad.
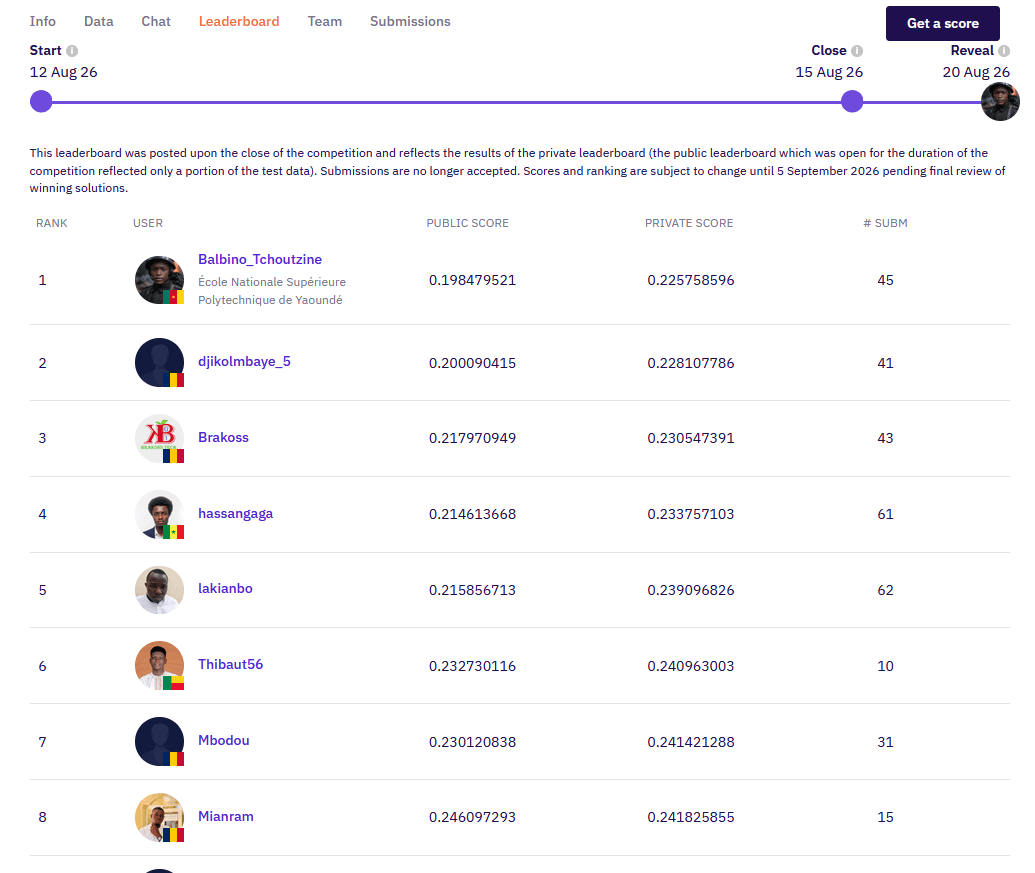
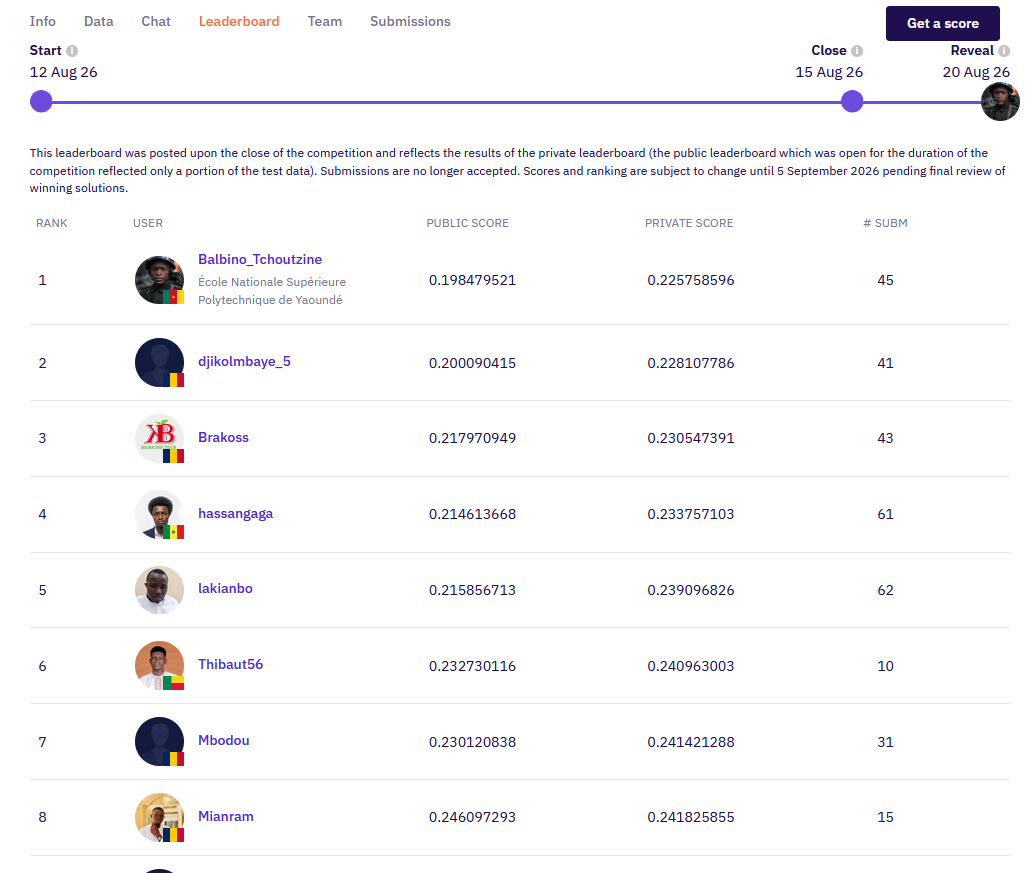
Under the handle Zoom387, I submitted my solution on August 15, 2026. Public score: wMAPE of 0.19848, 3rd place on the public leaderboard. On the private leaderboard, the one that actually counts: 1st place.
The challenge: predicting yields that don't exist yet
The task was simple to state, hard to execute: predict yield (Rendement_kg_ha) by province, crop, and agricultural campaign, from satellite-derived climate and vegetation indicators plus historical yields.
Three obstacles made it genuinely difficult:
- Sparse data: only about 1,800 training rows.
- Predicting the future: the test years (2024/2025 and 2025/2026 campaigns) have no known cultivated area or production, only climate indicators.
- Cold starts: the crop Fonio and the province Ennedi Est only appear in the test set, never in training. There's no history to lean on for either.
The official metric, wMAPE, weights errors by cultivated area:
wMAPE = Σ(area_i × |yield_i − prediction_i|)
        ─────────────────────────────────
              Σ(area_i × yield_i)
Getting a large farm wrong costs more than getting a small plot wrong. That's why the training target (see below) is weighted by area too: the model learns to directly minimize the right error, not a proxy for it.
Building features with zero external data
The challenge rules required working only from the files Zindi provided (train.csv, test.csv): no FAO, NASA POWER, FAOSTAT, or any other external dataset was allowed. In practice that meant every climate or vegetation signal had to already exist in the provided columns, and everything else (trends, cold starts, aggregates) had to be reconstructed from the yield history sitting in train.csv alone. No falling back on longer or more reliable external climate series to patch the gaps.
The feature families I built, and what each one contributes:
- Yield history (province x crop): lags 1 to 3, rolling mean/std/median, linear trend. This is the strongest signal in the problem: a crop's yield in a given province is heavily autocorrelated from one campaign to the next. The lags give the recent level, the rolling std captures volatility (an erratic crop needs to be predicted more cautiously), and the linear trend picks up slow dynamics (improving practices, soil degradation) that the lags alone miss.
- Aggregates: statistics by crop, by province, by zone x crop, by province x crop. These act as a statistical safety net: when the history for a specific province x crop pair is short or noisy, the model can fall back on averages at a broader level instead of overfitting to three or four data points.
- Climate: current-year vegetation index (wVHI), temperature, precipitation, humidity, plus anomalies relative to the province's historical average. This is the only signal available for the test years, which have no known area or production. Anomalies (deviation from the local norm) matter more than raw values: a dry season hits differently depending on whether a province is normally arid or humid.
- Cold-start proxies: Fonio inherits the behavior of related cereals (millet, sorghum) by province and year; Ennedi Est inherits from neighboring Sahelian provinces (Kanem, Barh El Ghazal, Wadi Fira, Batha). Without this, the model would have zero history to draw on for either case and would have to extrapolate blind.
- Encodings: smoothed target encoding and label encoding for Province, Crop, Zone, and Category. Smoothed target encoding lets the tree models pick up the average yield level tied to each category directly, without exploding the number of splits needed compared to plain one-hot encoding on high-cardinality variables.
The training target was log1p(yield), with sample weights of log1p(area) to directly align training with the wMAPE logic.
The pipeline: five models, one stacker, sequential inference
Why five tree models instead of one well-tuned one? With only 1,800 training rows, a single model, however well optimized, stays sensitive to the noise in its own learning bias. The idea comes from the stacking literature in ML competitions (well documented across Kaggle): models that make different errors, even when individually close in score, correct each other once combined. I picked these five specifically because they don't share the same bias:
- LightGBM and XGBoost both do gradient boosting, but with different tree-growth strategies (leaf-wise for LightGBM, historically level-wise for XGBoost), so they don't make quite the same mistakes.
- CatBoost handles categorical variables natively with ordered boosting, which limits overfitting on Province, Crop, and Zone compared to plain target encoding fed in upstream.
- HistGradientBoosting (scikit-learn) uses histogram-based feature binning, an approach close to LightGBM's but with its own regularization.
- ExtraTrees breaks the boosting logic entirely: it's an ensemble of fully randomized trees, no sequential boosting, contributing raw diversity rather than fine-tuned optimization.
These five models, trained in parallel, are then stacked through a Ridge meta-learner on their out-of-fold predictions, and calibrated per crop to correct systematic bias without extrapolating.
The detail that changed everything: the test years aren't independent. Predicting 2025 needs 2024 history that doesn't exist yet at training time. The fix: predict 2024 first, feed those predictions back in as pseudo-labels, rebuild the features with that extended history, then predict 2025. Sequential inference, not a simple batch job.
Last step: instead of keeping a single random seed, the final solution takes the row-wise median of predictions from three different seeds (7, 456, 789). More robust than a mean against a seed that goes off, and it beat every alternative I tested (mean, geometric mean, more elaborate blends) on the public leaderboard.
A few bumps along the way
The final pipeline wasn't the first thing I tried. Several approaches that looked reasonable on paper actually hurt the public score:
- A "time-safe" rewrite of the feature engineering (more rigorous in theory): wMAPE ≈ 0.287.
- Splitting the model by crop category instead of one global model: wMAPE ≈ 0.299.
- More aggressive shrinkage on the predictions: wMAPE ≈ 0.203.
Keeping these in the solution documentation, even after finding something better, mattered to me. It shows the actual path taken, not just the finish line.
Result
| Split | Score (wMAPE) | Rank |
|---|---|---|
| Public | 0.198479521 | 3rd |
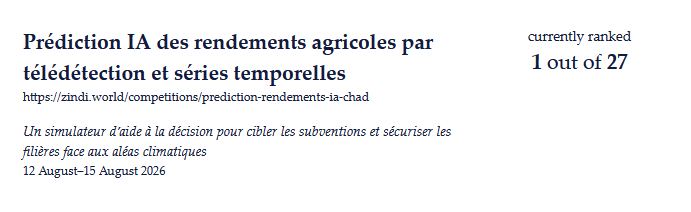
| Private | 0.225758596 | 1st out of 27 |
Submission v16_3 (ID e3vJYTzM), August 15, 2026. Zindi notes this ranking is subject to change until September 5, 2026, pending final review of winning solutions, standard procedure for top finishers.
Reproducibility
The full solution is on GitHub: notebooks, source code, Zindi data, complete documentation (README.md, SOLUTION.md, CODE_REVIEW.md).
github.com/zoom-BT/zindi-chad-crop-yield
python generate_submission.py regenerates the exact submitted file in under 5 seconds from the archived predictions. The 02_train_from_scratch.ipynb notebook reruns the full training of all five models if you want to verify the method end to end.
Fun fact
This challenge checks exactly the boxes I care about right now: geospatial ML applied to a real problem (food security), time series with hard constraints (predicting a future with no future data), and a data-poor setting where feature engineering matters more than raw compute.
It's also my ongoing training ground as a Zindi Ambassador: 19+ challenges to date, and this is probably the most technically complete one so far. The full solution documentation (architecture, ETL, modeling choices, error handling) is written to the format Zindi asks its winners for, exactly as if it were going to be audited by a judge.
This challenge also moves my overall Zindi ranking forward:

All-time ranking, Cameroon: 8th of 285

2026 season ranking, Cameroon: 6th of 133
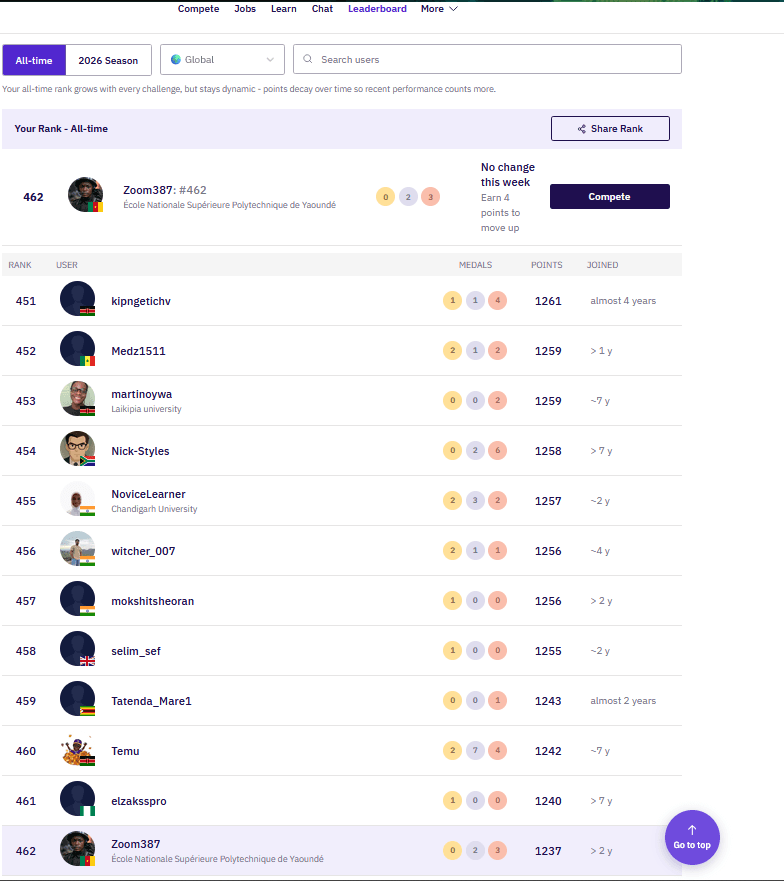
All-time ranking, global: 462nd of 17,834

2026 season ranking, global: 422nd of 5,085